WireTrace
Multi-device, built for the throughput real hardware bring-up demands.
v1.1.0 · Windows · Open source · MIT
Why this exists
WireTrace was built for an internal need on my team. We work across a range of problems in research and development, and serial monitoring is one of the things that comes up often — when we are bringing up new hardware, capturing data from a device for later analysis, or trying to make sense of what a board is reporting.
We had been using whatever serial tools were already available, and over time the gaps in those tools started to add up. WireTrace started as something to fill those gaps, and grew from there.
What came before
The first version (called SerialLoggerPro) was a single Python file built on Tkinter. It worked for the original use case — one port, one device, one log file — but the way it was structured made it hard to extend. Threading was managed manually with locks. The dependency list grew as each new feature pulled in something else.
Adding multi-device support would have meant rewriting the threading model. Adding cleaner exports would have meant replacing the export pipeline. Each new addition would have made the next one harder to add cleanly.
At that point, continuing to patch the existing code stopped making sense. The decision was to start over with an architecture that could support what the application needed to become.
What it is now
The current version, WireTrace v1.1.0, is built on PySide6 (Qt6 for Python) and organized into modules with single responsibilities. The serial reader handles only serial I/O. The disk writer handles only disk I/O. The component that filters the on-screen view does not interact with the disk log. These boundaries make it possible for the application to do several things at once without one part interfering with another.
Each connected device opens in its own tab with its own thread, reading from its own port into its own buffer, and writing to its own log file. Multiple USB-to-serial adapters can be connected simultaneously without one device’s data interfering with another’s.
Logging uses a buffered write model. Incoming data is appended to an in-memory buffer with a hard size cap, and a separate thread flushes that buffer to disk on a timer. The read path is never blocked by disk I/O. If the application exits or crashes, the buffer is flushed before shutdown. The log file on disk is the source of truth — it contains every line received, regardless of what the on-screen view is showing at any moment.
The source is available on GitHub under the MIT license. The tool is designed to be installed from a binary, but you can clone the repository and build it yourself if you prefer.
Features
Multi-device tabs. Each connected device runs in its own tab, isolated from the others. Switching between tabs does not interrupt data capture on any of them.
Buffered logging. A separate thread writes to disk on a schedule. The read path is never blocked. The disk log captures every line received, regardless of what is shown in the live view.
Search and live filter. Search captured data with forward and backward navigation. Filter the live view by substring without affecting what is written to disk.
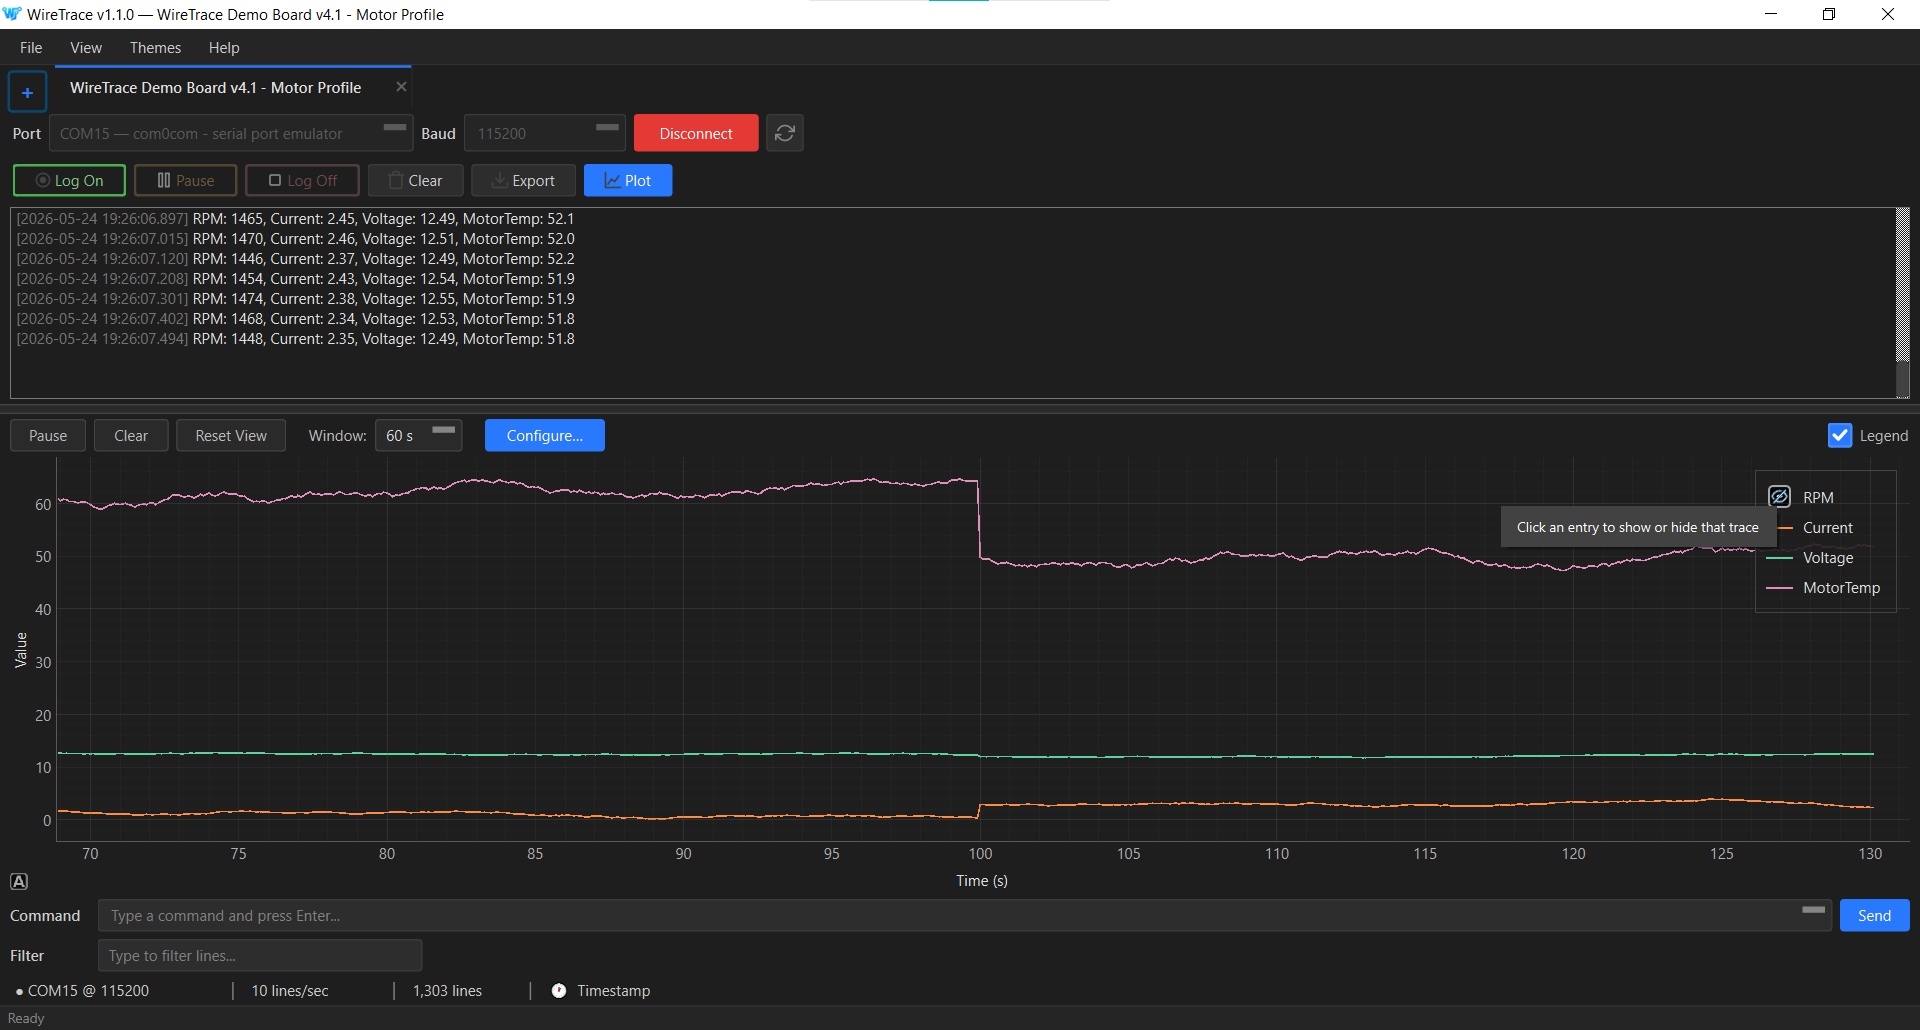
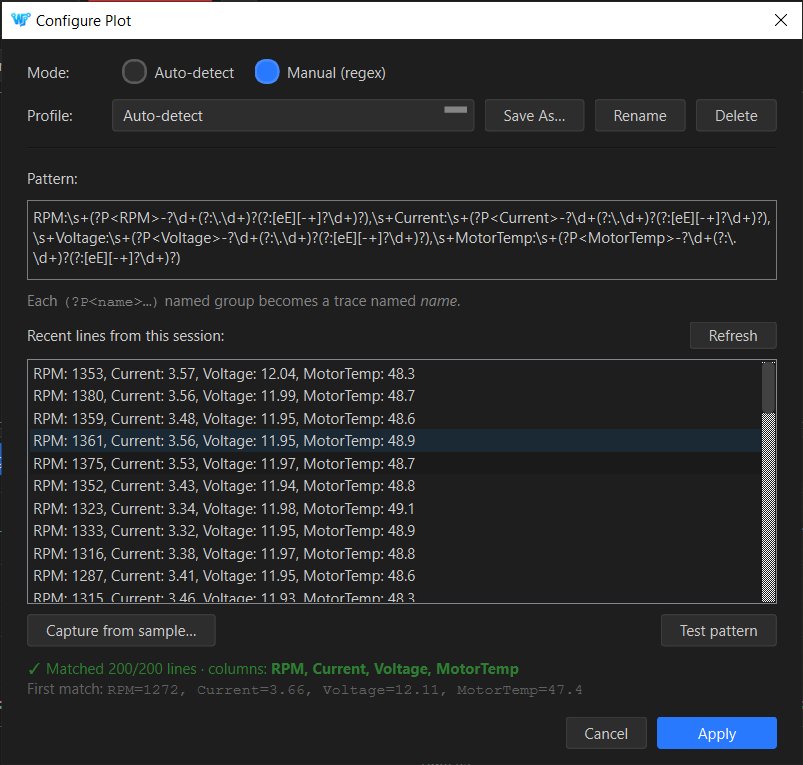
Live data plotter. Auto-detects numeric structure (JSON objects, key:value pairs, or positional delimited values) from the first fifty data lines and renders them as time-series traces in a docked panel below the console. When auto-detect is not enough, a Configure Plot dialog lets you declare a regex with named groups, save it as a profile, and set a per-tab default — for firmware that emits its own timestamped or log-prefixed format. Theme-aware, colourblind-safe palette, per-trace toggle from the legend.
Structured CSV export. Two modes. Auto-detect identifies common patterns in the data — key:value pairs and JSON-shaped lines — and pivots them into named columns. Raw mode writes a two-column file with timestamps and lines.
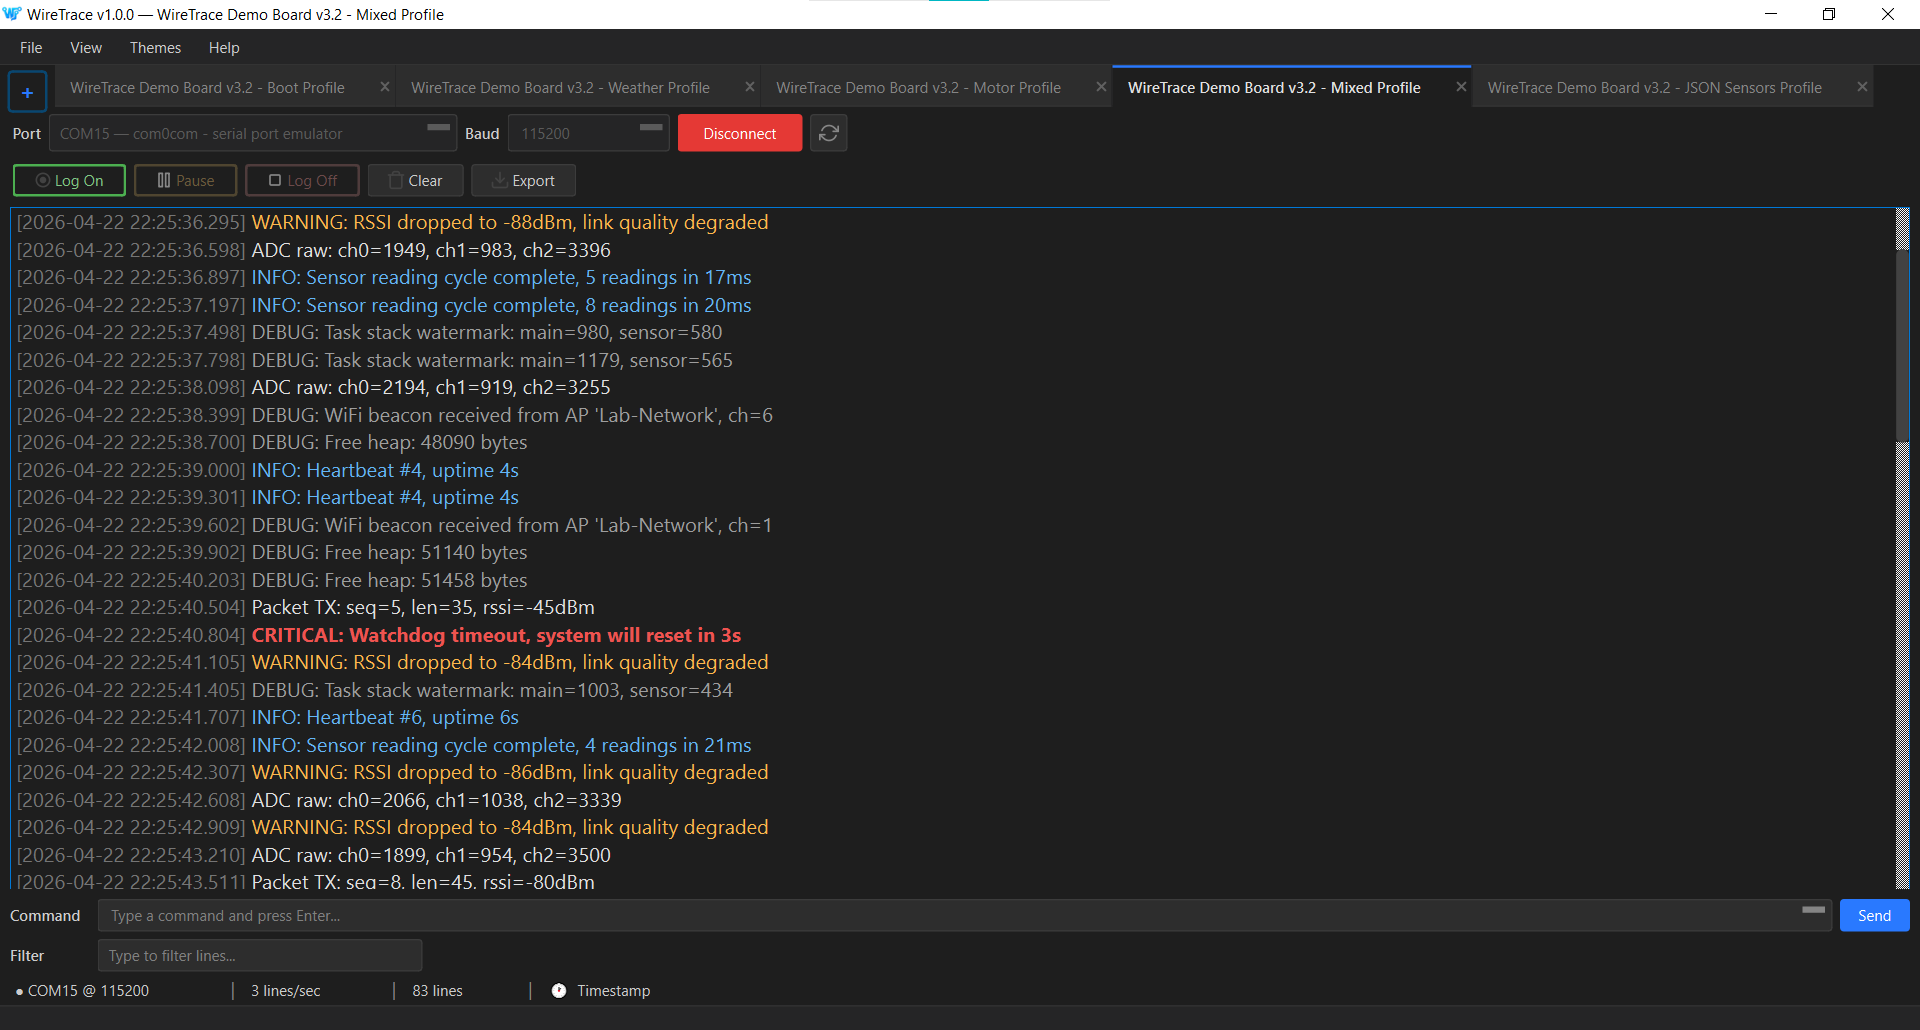
Severity tagging. Each line is automatically tagged based on its content as one of CRITICAL, ERROR, WARNING, INFO, DEBUG, COMMAND, or DATA. Tags are color-coded in the console.
Command console. Send commands back to the connected device, with a recallable command history.
Two themes. Studio Light and Midnight Dark, switchable from preferences.
Specifications
| Sustained throughput | 10,000+ lines per second |
|---|---|
| Cold startup | Under 2 seconds |
| Memory per tab (idle) | Under 15 MB |
| Supported baud rates | 50 to 4,000,000 (custom values typed) |
| Display modes | Text, hex |
| Export formats | Plain text, CSV (auto-detect or raw) |
| Themes | Studio Light, Midnight Dark |
| Platforms | Windows 10+ (64-bit) |
System requirements
WireTrace is designed to run on Windows, macOS, and Linux. The codebase is cross-platform — it uses Qt for the UI, QSerialPort for serial I/O, and a build pipeline that produces native binaries for all three operating systems.
Pre-built binaries are currently published for Windows only. This is a practical limitation of who maintains the project, not a design limitation of the software. If you want WireTrace on macOS or Linux, you can build it from source using the included build scripts — the build guide in the repository covers all three platforms. If there is enough interest, pre-built macOS and Linux binaries become a realistic priority.
WireTrace uses CPU-only software rendering, which means it works in remote desktop sessions, virtual machines, and hardware without dedicated graphics.
Keyboard shortcuts
| New tab | Ctrl+T |
|---|---|
| Close tab | Ctrl+W |
| Start logging | Ctrl+N |
| Quick save | Ctrl+S |
| Export | Ctrl+E |
| Search | Ctrl+F |
| Filter | Ctrl+L |
| Toggle live plot | Ctrl+Shift+P |
| Next match | F3 |
| Previous match | Shift+F3 |
| Clear search | Escape |
| Preferences | Ctrl+, |
Download and install
Download the Windows installer from the GitHub Releases page. Run the installer and follow the prompts. The application launches from the Start menu. On first launch, the welcome screen prompts for a device connection — the rest of the interface appears once a device is connected.
For macOS or Linux, clone the repository and build from source. Instructions are in the repository’s build guide.