May 2026
WireTrace live plotter, and where it came from
How a comment on the r/embedded launch thread reshaped the v1.1.0 plotter — what shipped, and which part of it was somebody else’s idea.
A stranger on Reddit designed part of WireTrace’s new plotter before I did.
The plotter, and how it knows what to plot
WireTrace v1.0.0 shipped in April with multi-device tabs, structured CSV export, severity tagging, and the buffered logging path that does not block on disk I/O. It did not have a plotter. If an engineer wanted to see their RPM or temperature trace over time, they exported the log and opened it somewhere else.
The plotter was the obvious next thing to build. The data pipeline already fans out the parsed line signal to multiple subscribers — the console view and the log engine are two of those today — so adding a third subscriber that draws a chart did not require restructuring the data flow. The actual question was always how the plotter would know which numbers in a line are the ones to plot, and what to name them on the axes.
Two mechanisms ship in v1.1.0. The default is auto-detection: WireTrace samples the first fifty DATA-tagged lines on a tab, infers structure (JSON objects, key:value pairs, or positional values with an auto-detected delimiter), and accepts a column only if it appears in at least seventy percent of the sample lines. The threshold filters out boot banners, debug spam, and the occasional stray colon from a free-text log line that otherwise would corrupt the detected schema.
The second mechanism is a prefix protocol: plt:, plt0:, plt1:, and so on. A line that starts with one of these prefixes is plotted; everything else is treated as ordinary log output and ignored by the plotter. Engineers who want explicit control — or who emit mixed traffic where auto-detect would guess wrong — mark their plot lines at the source and WireTrace does the rest. The prefix protocol came from somebody else.
Where the prefix protocol came from
WireTrace v1.0.0 launched on r/embedded in April. One of the comments was from u/Stromi1011, who pointed out that there was no plotter and proposed a specific way to add one:
Ideally i can specify a prefix in the software, say “plt*” and afterwards i can send csv line style data like “plt0:x,y,z”, “plt0:10,4,6”, “plt0:9,4,7” ... and the software associates all of this to a plot 0, allowing for multiple plots like “plt1:” in like tabs or something.
Two things about this comment made it stick. First, the proposal was complete: prefix, payload format, and the multi-plot extension via the trailing digit. There was no ambiguity about what the engineer was asking for. Second, the framing acknowledged something true about the problem space — engineers are the ones who design their firmware’s output format, so an explicit marker they put in their own protocol is more reliable than any amount of clever guessing on the receiver’s side.
At that point a plotter was on my list of next things to build, with auto-detection from key:value and JSON as the leading approach since the CSV export engine already did similar pattern recognition. The prefix idea was not in my plan. It got added.
I replied on the thread saying both approaches were worth building, and opened a GitHub Issue to track it: Feature: live data plotter. The issue references the original comment so the trail back is intact.
What shipped
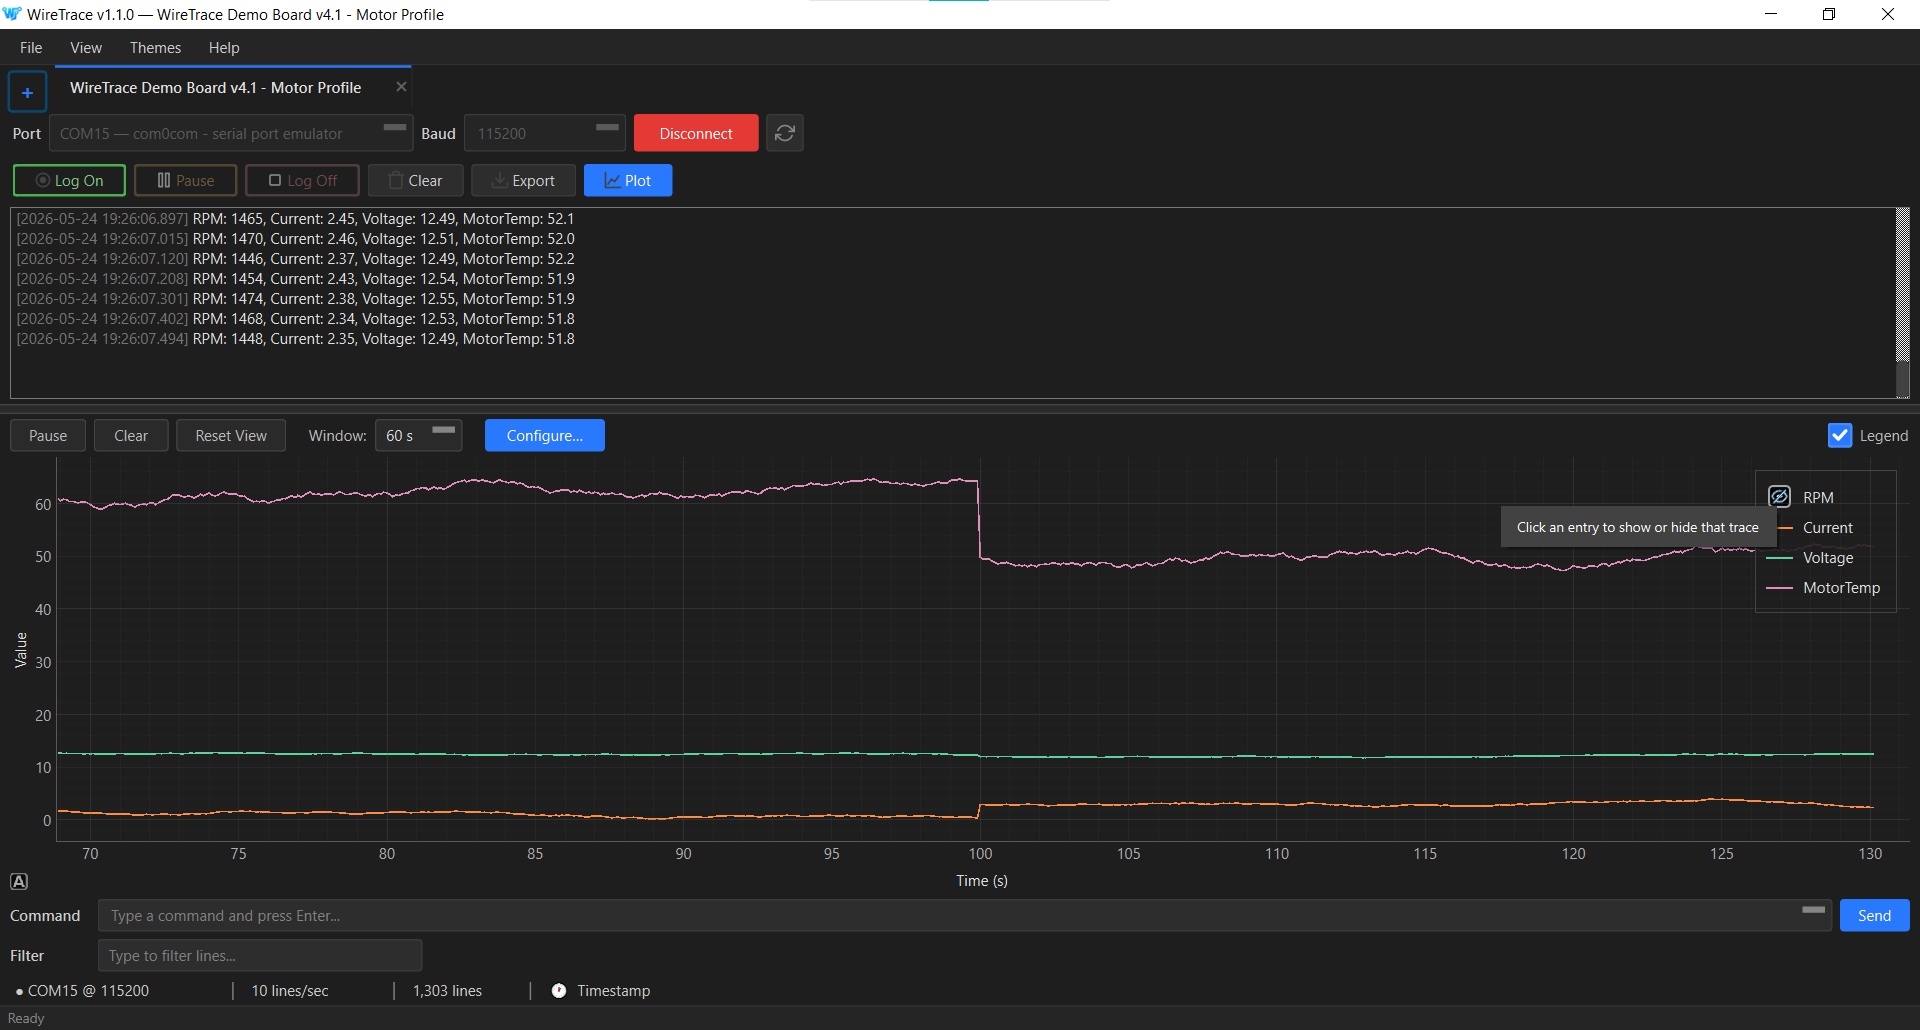
Auto-detection runs by default on every new tab. When it works — and on key:value or JSON traffic it usually does — the user sees a plot panel populate within a couple of seconds of the data starting to flow, with sensible column names taken directly from the keys. No configuration step, no first-run dialog, no setup screen between the user and their data.
When auto-detection cannot make sense of a line, the panel shows a small placeholder with a single call to action: Configure manually. That opens a dialog where an engineer declares a regex with named groups — each (?P<name>...) becomes a plot column with that name on the axis. Patterns can be saved as named profiles, applied to a tab as a default, and reused across sessions.
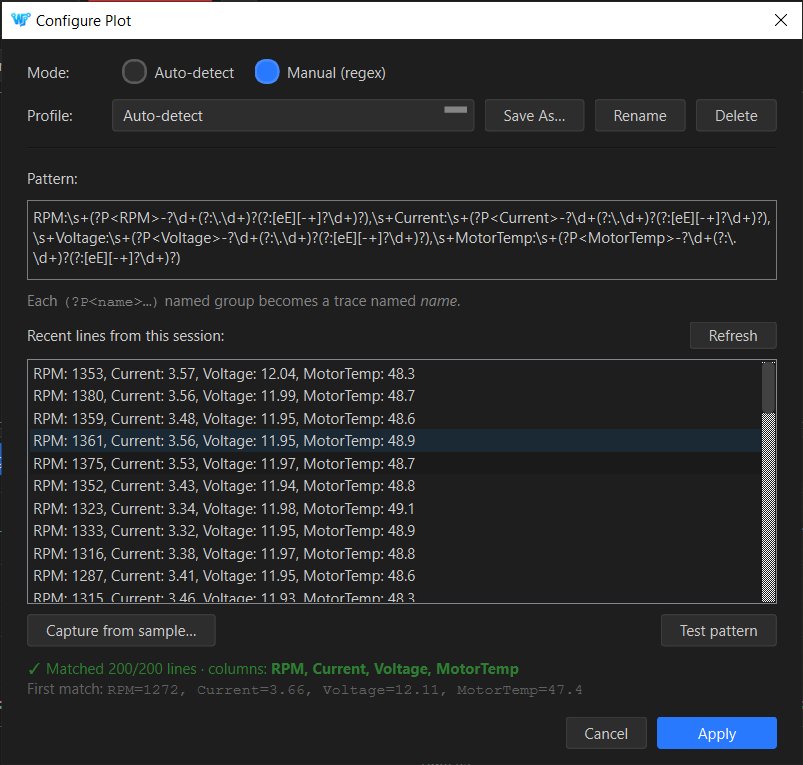
The Test result is tiered rather than binary. Green means the pattern matched recent lines; amber means the pattern compiles and is structurally valid but no current line matches (the firmware may simply be quiet on that data path right now); red means the regex is broken. Apply is enabled for green and amber, disabled for red. There is no intermediate “the regex is sort of OK but trust me anyway” state.
Capture from sample
Writing regexes by hand is one of those tasks that engineers either enjoy or actively avoid; there is rarely a middle. For the half who avoid it, the Configure Plot dialog has a Capture from sample assistant. Pick a recent line from the session, click each number you want to plot, give it a name, and the dialog scaffolds the regex for you.
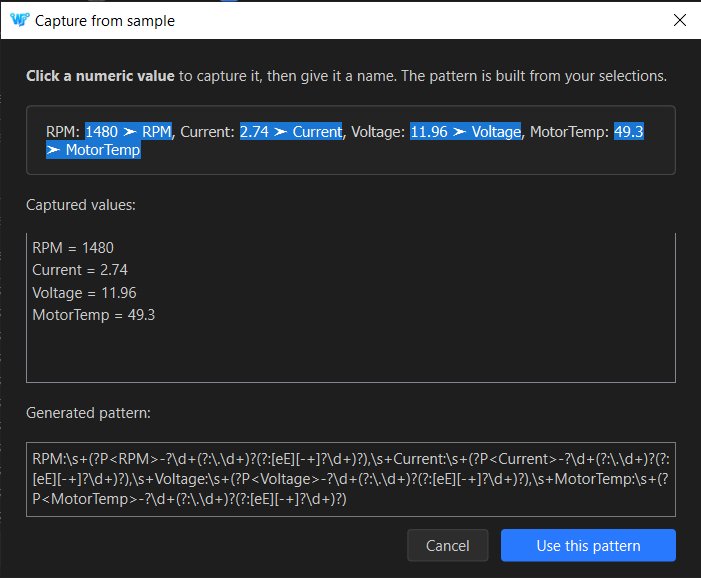
The chip-based capture step also handles the part of regex authoring that catches even experienced engineers — escaping decimals, allowing optional signs, allowing scientific notation — so the generated pattern is correct against the actual data, not a transcription of what the engineer thinks the data looks like.
A small thing about credit
v1.1.0 ships plt0:x,y,z as u/Stromi1011 described it. There is one extension — a plt!Name1,Name2,... form that lets engineers name the columns explicitly when their payload values do not have keys — but the prefix routing, the multi-plot grouping via trailing digits, and the CSV-shaped payload are his proposal verbatim. The GitHub Issue and the User Guide both link the original comment.
I do not have a tidy moral about open-source feedback to offer here. The thing that happened is the thing that happened: a stranger on Reddit read the v1.0.0 announcement, thought about a feature that was not there, wrote down a concrete proposal for it, and the proposal was good enough that it shipped. The plotter is a better feature for including both auto-detect and the prefix protocol than it would have been with either alone. Crediting the source seems like the unremarkable correct thing to do.